Workshop 3 Visualization with ggplot I
3.1 Before we get started
Having trouble remembering what exactly an R Markdown is? Want some more resources for learning R?
3.1.1 Recap: What we learned in the previous tutorial
In the last tutorial, we learned a few things about R packages, as well as data manipulation within R:
- How to install and load packages
- The data manipulation grammar of dplyr
- How to integrate the tools in dplyr for tidy data manipulation
- Solutions to common data manipulation problems
- Ideas for other data manipulation problems we may come across here
3.1.2 Overview: What we’ll learn here
What we’ll look at here:
Visualization
- The basics of building ggplots
- Commonly used ggplot features
- The final two parts of the ggplot grammar
- Making plots presentable
In past tutorials, we have gone over how to get your data into R, how to take a preliminary look at your data, and how to manipulate your data to prepare it for analysis. Now, that we know how to wrangle our data, we can dive into learning what R is famous for: visualization.
Let’s start by reading in our data:
3.2 Visualization I: Building ggplots
Why is visualization important? Visualization gives us a window into our data, and thus can be powerful for exploring what we have and presenting the patterns we find.
In this workshop, we’ll introduce the visualization powerhouse of the tidyverse: ggplot2.
ggplot2 is a plotting library for R and, of course, is a member of the tidyverse. ggplot uses a grammar of graphics that gives us an easy, flexible way to create beautiful plots. There are a ton of different options, so feel free to explore these with Google as a guide. Here is just one of many helpful websites.
3.2.1 ggplots: How do they work?
Well. The answer is well.
Wickham and Grolemund (2017), two men behind the madness of ggplot2, explain the logic of ggplots in this way:
With ggplot2, you begin a plot with the function ggplot(). ggplot() creates a coordinate system that you can add layers to. The first argument of ggplot() is the dataset to use in the graph. So ggplot(data = mpg) creates an empty graph, but it’s not very interesting [by itself]. . . You complete your graph by adding one or more layers to ggplot(). The function geom_point(), [for example], adds a layer of points to your plot, which creates a scatterplot. ggplot2 comes with many geom functions that each add a different type of layer to a plot. Each geom function in ggplot2 takes a mapping argument. This defines how variables in your dataset are mapped to visual properties. The mapping argument is always paired with aes(), and the x and y arguments of aes() specify which variables to map to the x and y axes. ggplot2 looks for the mapped variable in the data argument.
Here’s what the general formula of ggplot then looks like:
    ggplot(data = <DATA>) +
     <GEOM_FUNCTION>(mapping = aes(<MAPPINGS>))
Also, for your enjoyment, a list of common aesthetics and geoms are provided at the end of this Markdown.
Now, let’s map this formula onto what Wickham and Grolemund told us:
- The only argument the basic function
ggplot()needs is your data (it can take more arguments, but we’ll discuss those later). This creates a blank graph.

Then, here’s where the magic of ggplot comes in: you can add as many new layers onto the blank graph as you like, using the plus sign (+). This ‘+’ is pretty synonymous with the pipe we learned, ‘%>%’; indeed, Wickham and Gromelund (2017) concede that if the pipe was invented when they created ggplot, they would have rather gone with that than their own symbol. Nevertheless, it’s very intuitive: you use ‘+’ to add new layers onto your graph.
The first layer we will always want to add to our graphs is a geom. Geoms are a type of layer that provide a way to map your data onto the graph.
geom_point(), as they were describing, adds “points” (i.e. a scatterplot);geom_smooth()adds a “smooth” line (such as a regression line);geom_bar()adds a bar graph.Inside each geom you have to provide certain information; most notably, mappings. The mapping argument, actually, is always matched with an aesthetic argument (
aes()), because the purpose of the mapping argument is to map aesthetic visuals onto our graph. That’s great for us, because it means that we can leave out the codemapping =when we use geoms, and can instead skip straight to theaes()argument. Why? Becauseaes()inherently implies we are using the mapping argument. Great.
Now that we have the basics down of the ggplot() formula, let’s dig in a little deeper…
If geom layers are a way to add our data to the graph and the aes() argument is telling that geom how to map aesthetics onto the layer, what exactly does it mean to “map aesthetics”? Aesthetics are simply the visual characteristics defining how our data will be presented: color, shape, size, as well as location. Because location is an aesthetic, this is where we can tell the geom what our x and y variables will be. Tell the geom what the data for each axis will be, and it can know where to put them, thus satisfying the most basic aesthetic–where to put stuff (the dots in our scatterplot example).
Let’s illustrate what we’ve gone over so far by plotting a scatterplot with the “miles per gallon” (mpg) and weight (wt) of the cars in our data set:

Great! Now practice doing a scatterplot with weight (wt) on the y axis and 1/4 mile time (qsec) on the x axis.
If you only indicate the variables needed to define coordinates for your dots, they show up in the simplest way possible: usually just black. So, if we change the color, shape, or size in aes() that will just change how our dots look, right? Actually, no. What?? Hear me out. color, shape, and size (and a few others we’ll get to later) within aes() don’t actually take arguments like “blue”, “round”, and “small” like you might expect–the argument they take is a factor variable. But how does that work? The reason is because these aesthetics define not just what our data will look like, but how it is organized. The factor variables that satisfy these arguments tell the graph how to split up the data on the graph: boys, for example, are red dots and girls are blue dots (color = gender). Or, if shape = condition, triangles are participants in the control condition and squares are participants in the treatment condition. If linetype = well_being_cat in a geom_smooth() (i.e. high and low categories of well-being), a solid line shows the regression for those with high well-being, while a dotted line shows the regression for those with low well-being. Arguments within aes() tell us how to put the data on the layer, and how to organize it once it’s there.
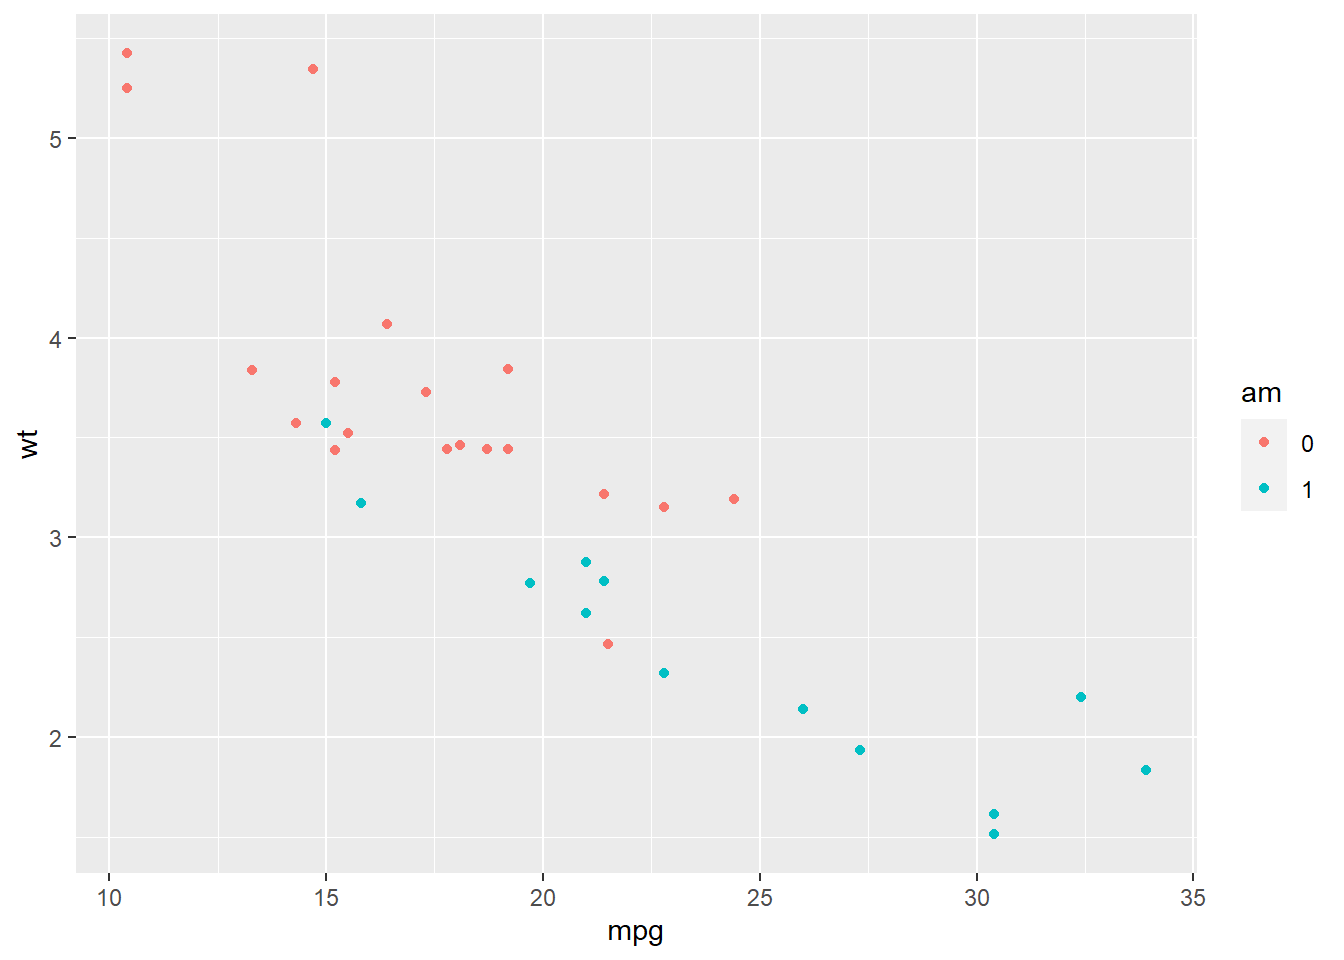
Here’s an example from our data where we organize the dots in our scatterplot by the cars’ type of transmission. Manual transmission is am==0 and automatic transmission is am==1:
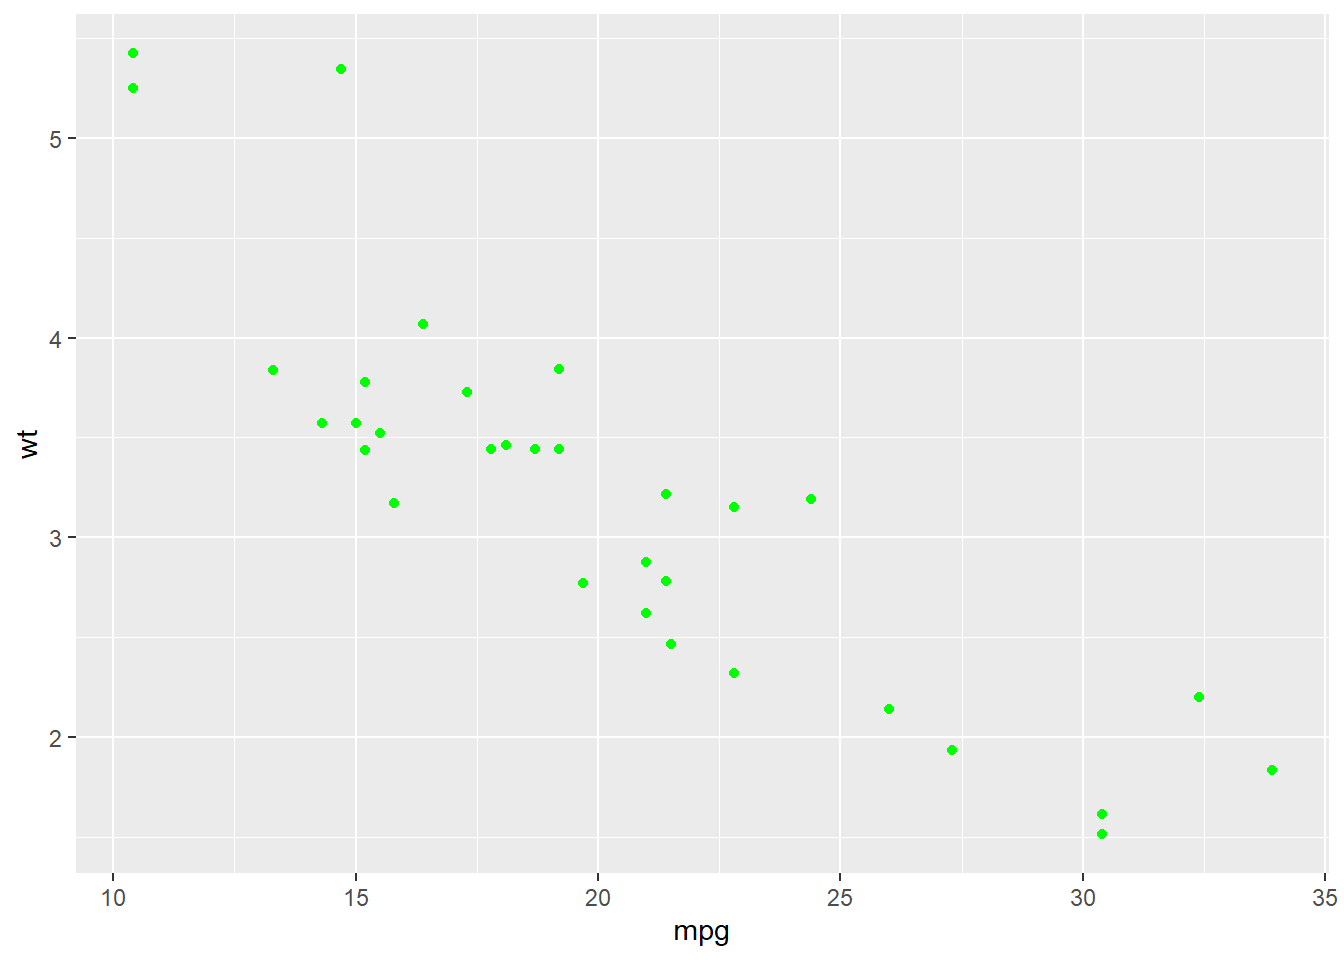
So, then, if we don’t break our data up into groups (or even if we do), how do we control what the normal color, shape, size, etc. look like? It’s pretty simple, actually: just use each of these arguments outside of aes(). For example, geom_point(aes(x = height, y = weight, color = gender)) will show us dots for height and weight colored by gender, while geom_point(aes(x = height, y = weight), color = “green”) will color all dots for height and weight green. Herein, ggplot provides us with lots of flexibility with how we organize and present our data in each layer.
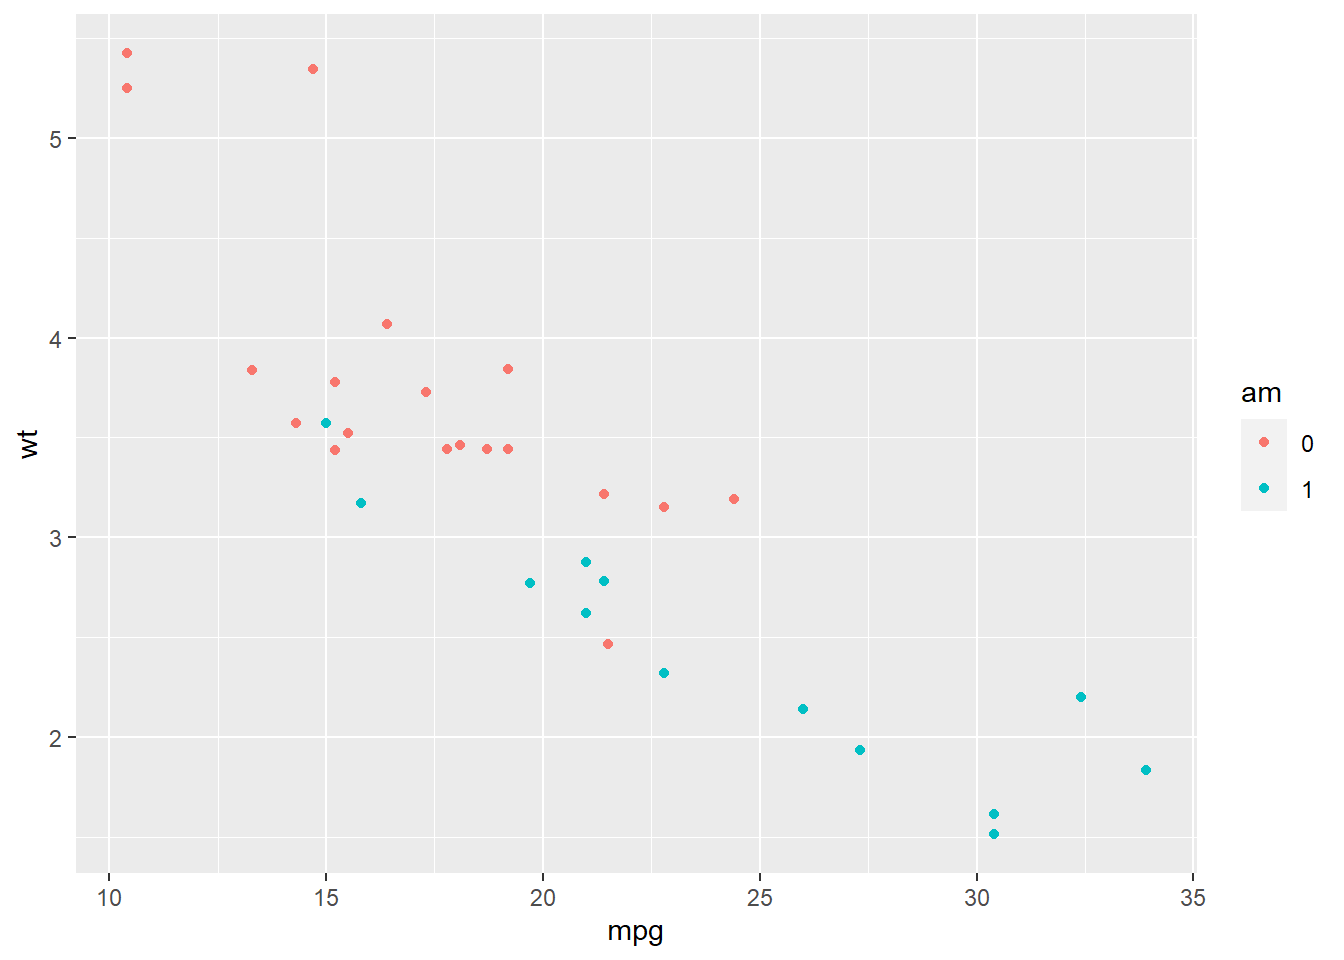
Here’s a comparison using our data:
Practice
Build a scatterplot with any two variables (say, hp and qsec), with the shape of the dots determined by whether the car has manual or automatic trasmission (am). Make the points “dark green”.
One more thing: how do you add multiple layers? Easy. Like we mentioned above, you need only add a ‘+’ after one layer and then start writing the next. In this way, you can superimpose as many different geoms or other types of layers on top of each other. There is one very important detail, though, that can be easy to gloss over: the ‘+’ has to come at the end* (or middle) of each line of code not the beginning of the line of code*. Also, you may find it slightly tedious to rewrite your variables in each and every geom and layer you add to your graph. Say, using our example, you wanted a scatterplot of mpg and wt, but you also wanted to add another layer, a regression line, on top. Given what we’ve talked about so far, you may write your code for your graph like this (also pretend like we’ve already told you that adding “method = ‘lm’” is a way to make geom_smooth give you a regression line):
## `geom_smooth()` using formula = 'y ~ x'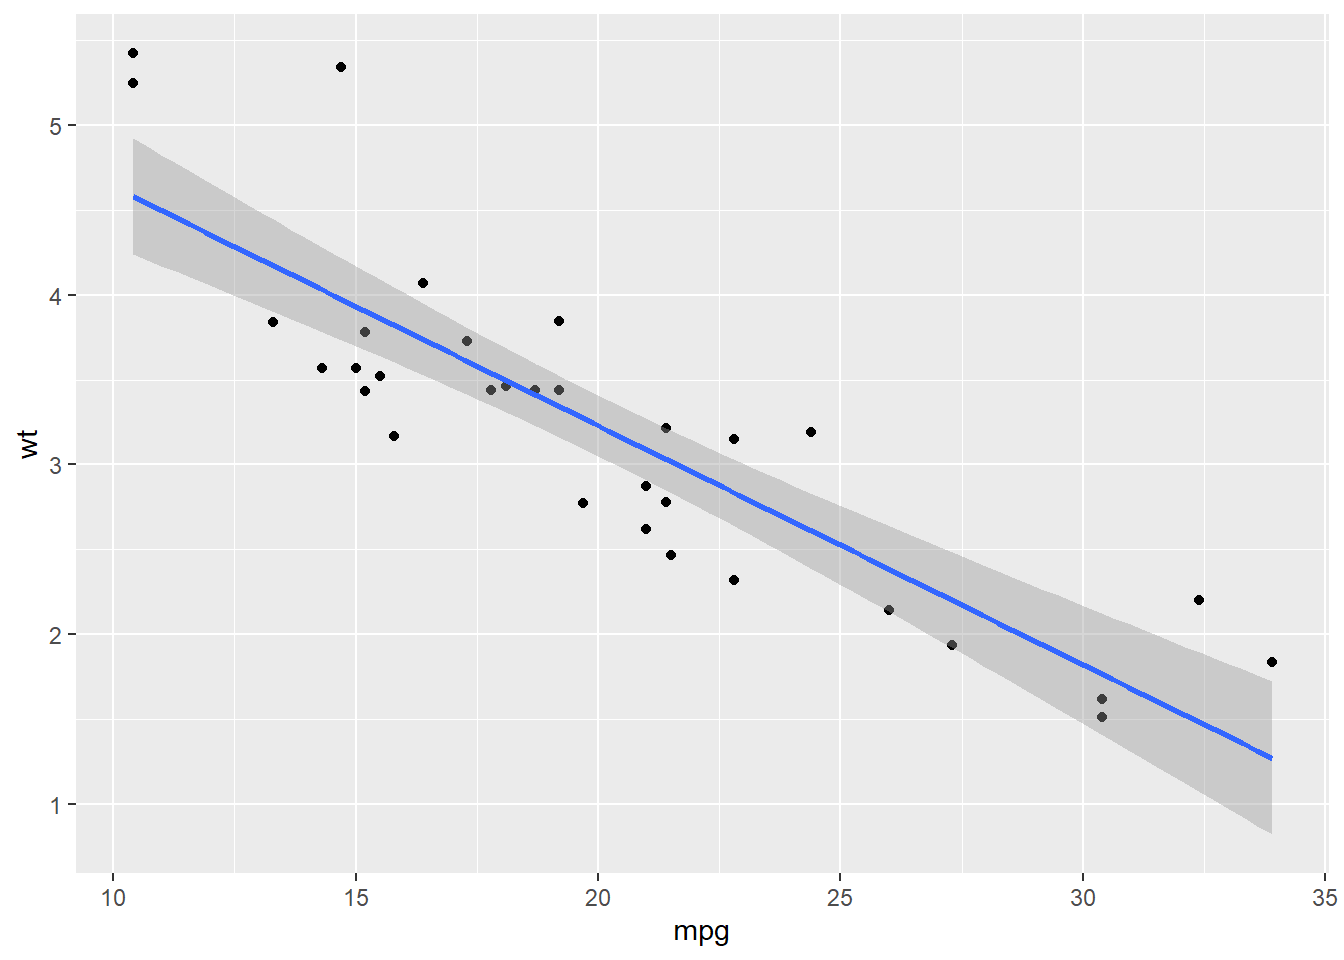
However, as a budding R pro, you find it a little annoying to have to write the data arguments twice over only two lines. Is there a better way to do this? I’m glad you asked…there is! While the data argument is the only argument you need in the main ggplot() function, it can also take mapping arguments–that is, aes(). If you add aesthetics to ggplot() they act as global aesthetics and apply to all layers, unless otherwise specified.
See how it works with our example:
## `geom_smooth()` using formula = 'y ~ x'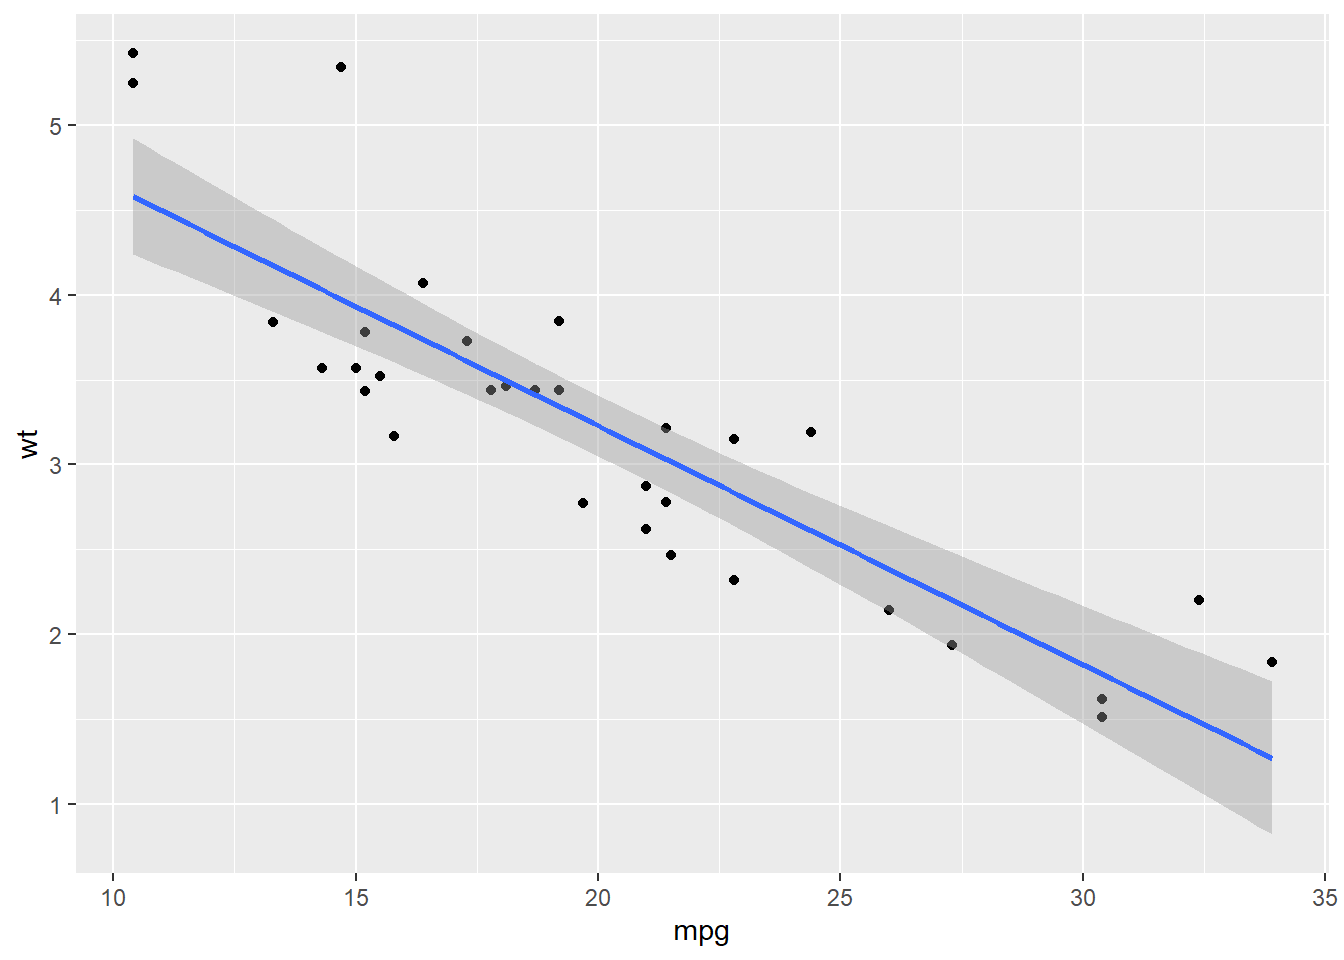
## `geom_smooth()` using formula = 'y ~ x'
Applying global aesthetics makes it easy to provide information to ggplot() that will be consistent across multiple (and sometimes many) layers. Of course, there is no requirement that information has to be consistent–part of the power of ggplot2 is that you can use different data and aesthetics flexibly across different layers.
For example:
ggplot(d) +
  geom_point(aes(x = mpg, y = wt), color = "red") +
  geom_point(aes(x = mpg, y = drat), color = "blue")
#or
ggplot(d, aes(x = mpg, y = wt)) +
  geom_point(color = "red") +
  geom_point(aes(y = drat), color = "blue")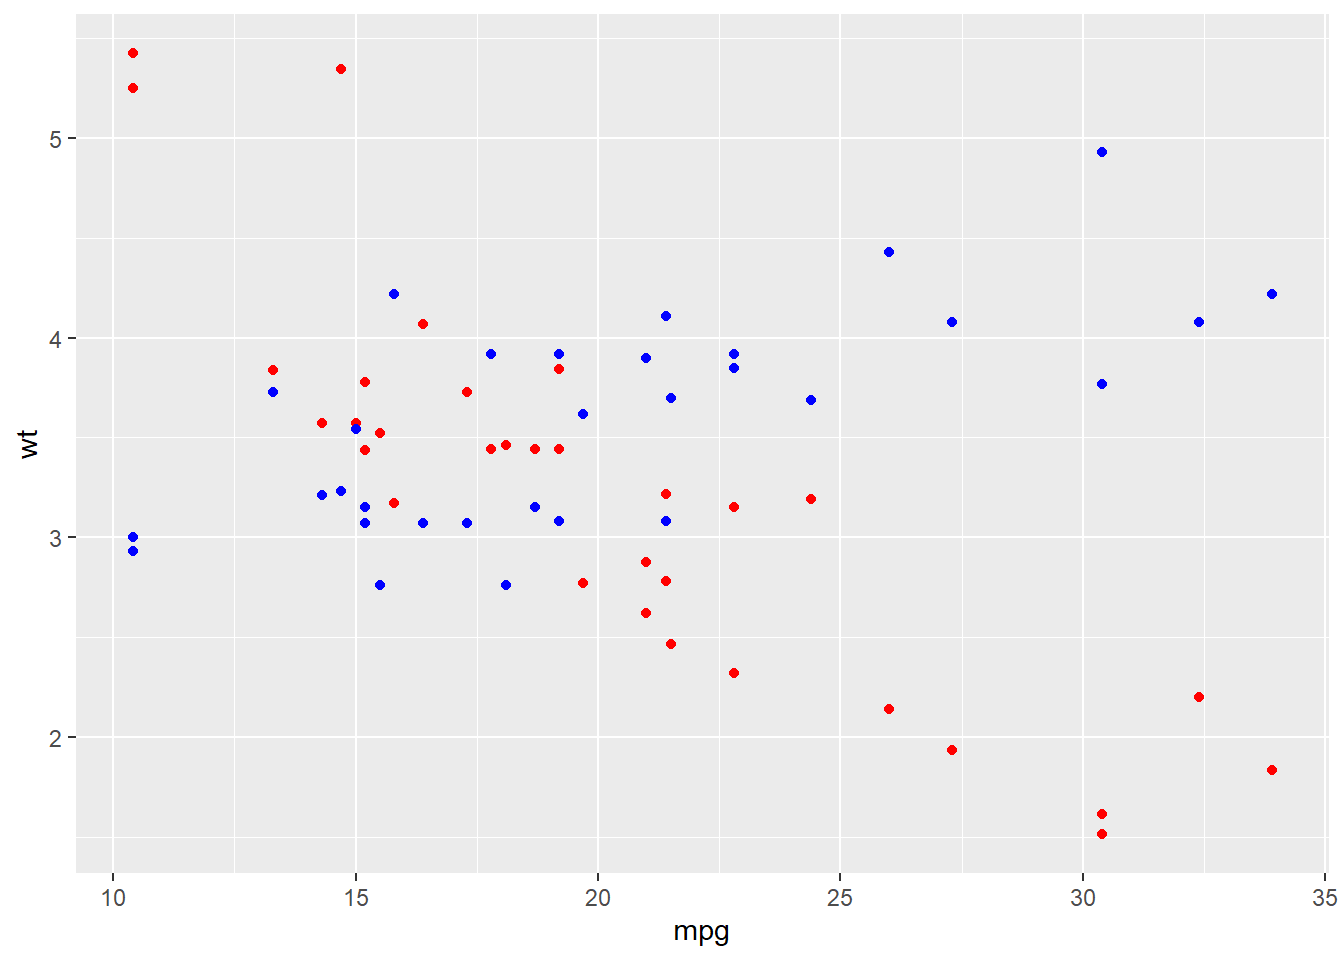
Note, again, as in the example above, that global aesthetics apply, unless you specify other information in a given layer. Also, note that you will need to be careful of axis labels when you have layers with different data: ggplot() will by default add the variables of the first layer as the axis labels.
3.2.2 Common geoms
3.2.2.1 Geoms for bivariate plots
| Geom | What It Does |
|---|---|
| Bivariate plots | |
geom_point() |
to plot a scatter of data points |
geom_smooth() |
To plot a line of smoothed conditional means with confidence intervals (e.g. fitted regression line) |
geom_line() |
To plot a line graph |
geom_col() |
To plot a bar graph–height representing values in a y variable |
First, we’ll make a couple of our variables into factors so that we can use them more easily:
d %<>% mutate(
      gear = factor(gear),
      am = factor(am),
      foreign = factor(foreign),
      vs = factor(vs),
      cyl = factor(cyl))
3.2.2.1.1 No need to aggregate: Point and Smooth
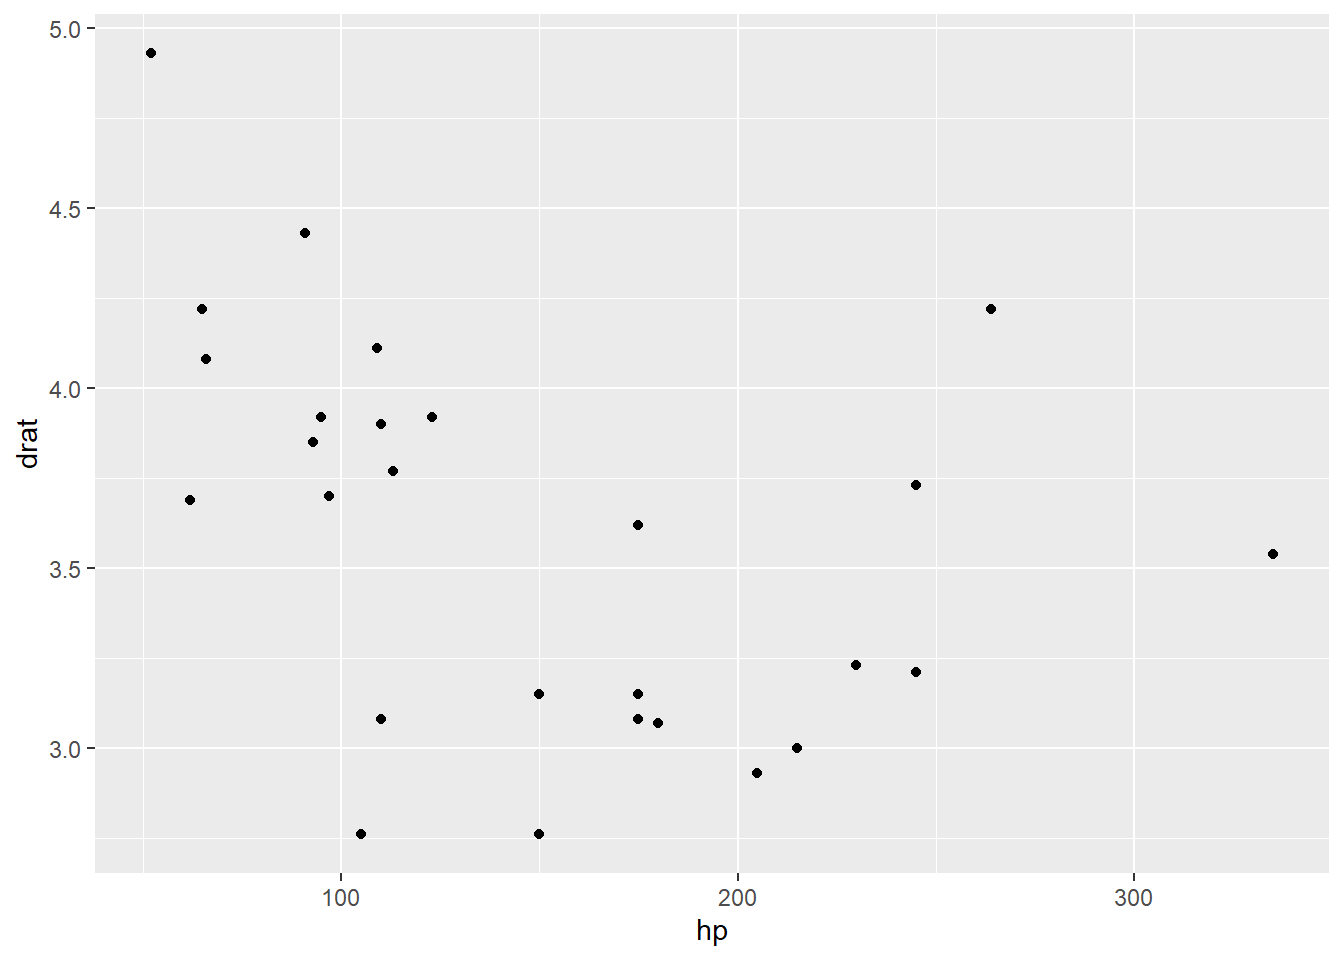
# geom_smooth (smoothed conditional means with confidence intervals)
d %>%
ggplot() +
  geom_smooth(aes(x = hp, y = drat))
## `geom_smooth()` using method = 'loess' and
## formula = 'y ~ x'
# geom_smooth (smoothed conditional means without confidence intervals)
d %>%
ggplot() +
  geom_smooth(aes(x = hp, y = drat), se = FALSE)
## `geom_smooth()` using method = 'loess' and
## formula = 'y ~ x'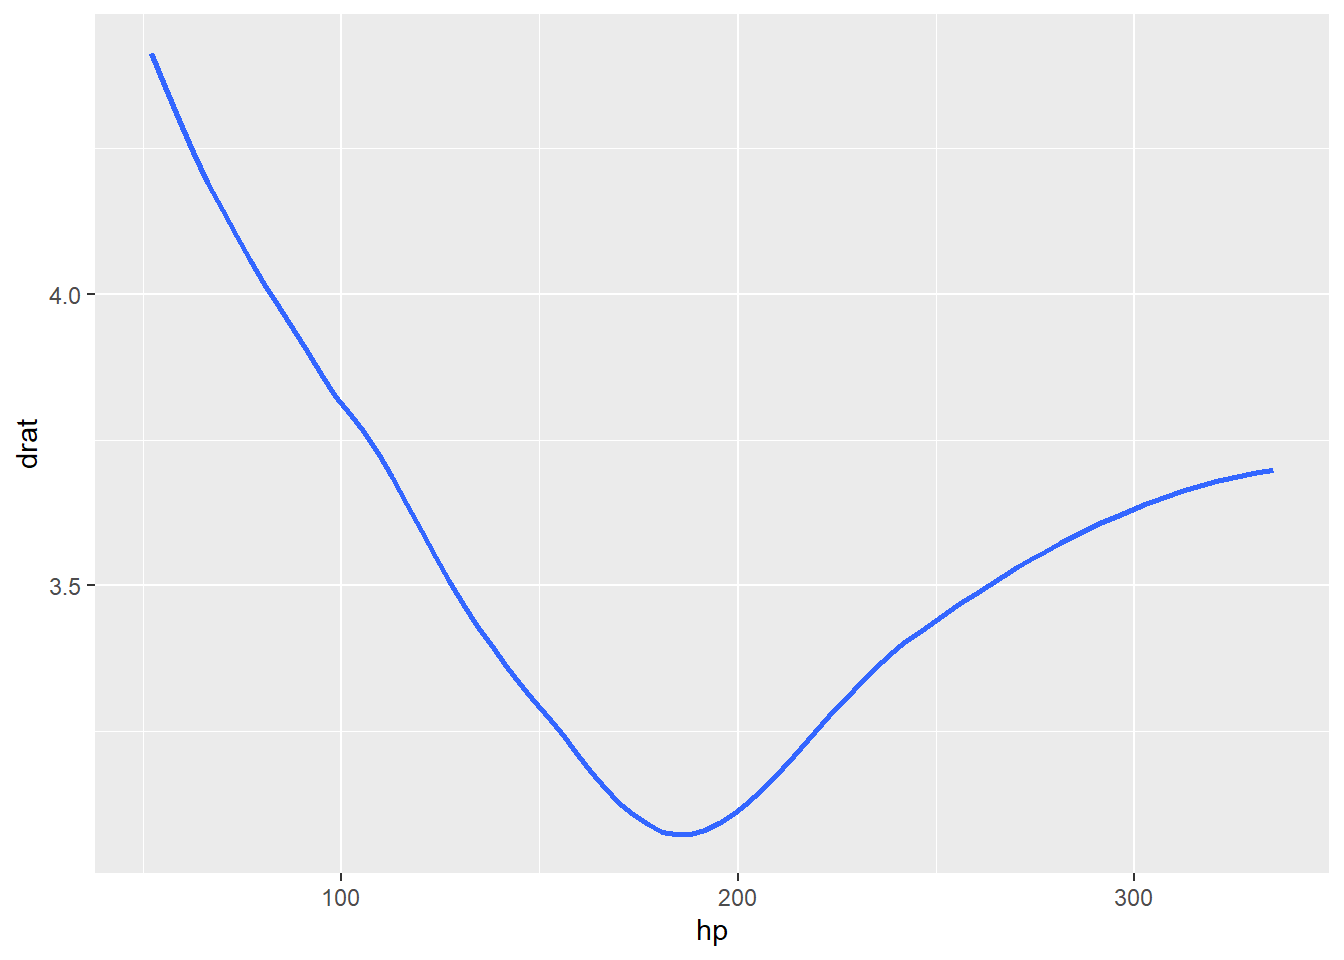
# geom_smooth (fitted regression line with confidence intervals)
d %>%
ggplot() +
  geom_smooth(aes(x = hp, y = drat), method = "lm")
## `geom_smooth()` using formula = 'y ~ x'
# geom_smooth (fitted regression line without confidence intervals)
d %>%
ggplot() +
  geom_smooth(aes(x = hp, y = drat), method = "lm", se = FALSE)
## `geom_smooth()` using formula = 'y ~ x'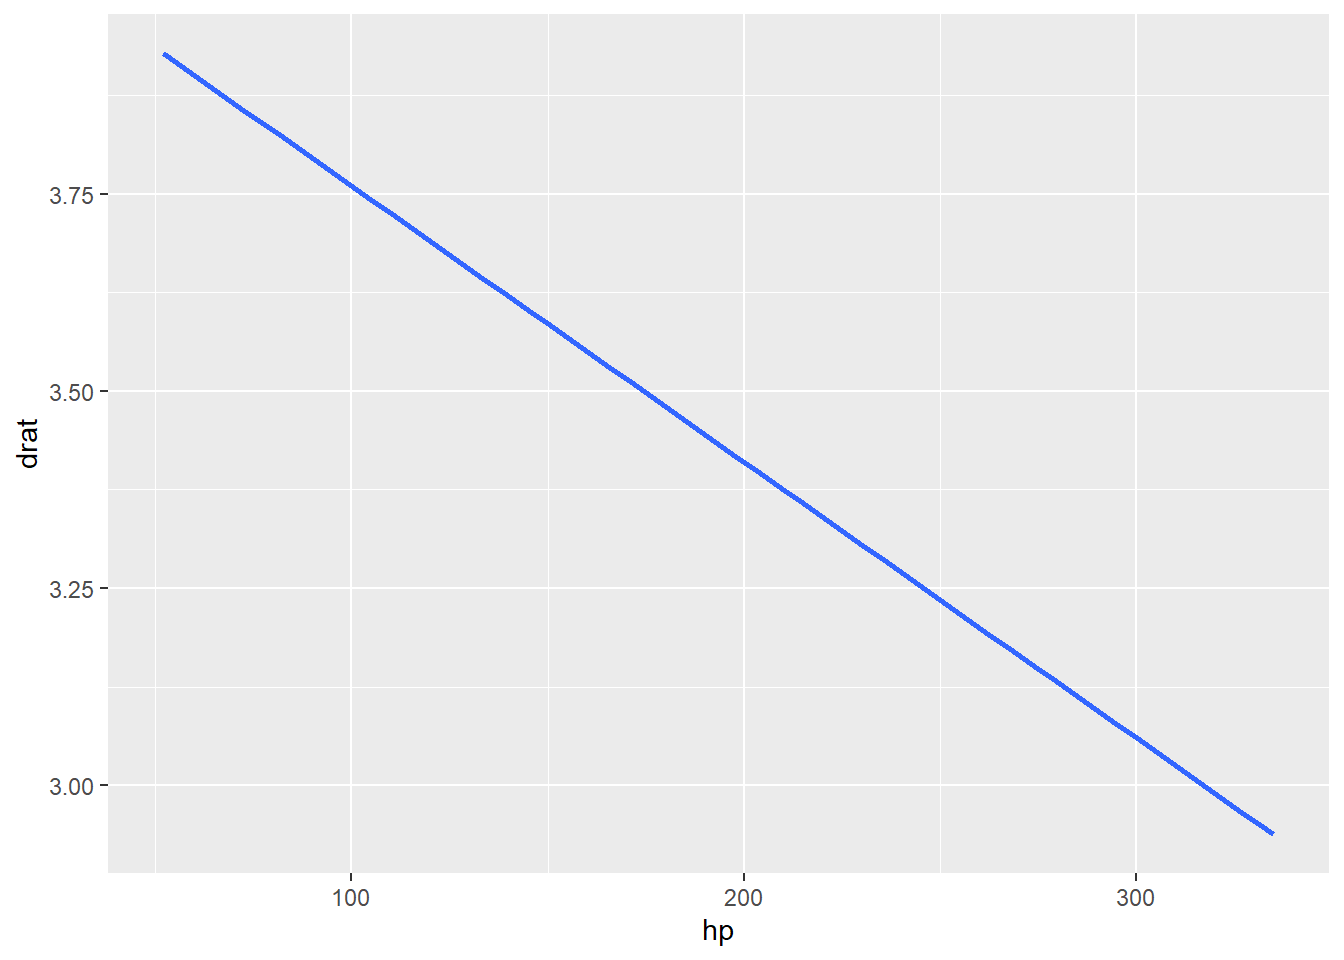
Practice
Build a scatterplot using any two continuous variables, set the shape of the dots and the linetype to any categroical variable. Add regression lines without confidence intervals. Make the dots and lines be dark red. Make the lines be thin (use the size argument, just like you would color, and set it to a number less than 1).
3.2.2.1.2 Lines and Bars: some aggregation needed
To use geom_line() and geom_col(), we may often want to aggregate our data into means first.
d_means <- d %>%
            group_by(cyl) %>%
            summarise(hp_mean = mean(hp, na.rm = TRUE), hp_sd = sd(hp, na.rm = TRUE))
Because these types of graphs are often used for comparing means across groups, we can use group_by() and summarise() to create a new data set of only means across groups for our variable of interest.
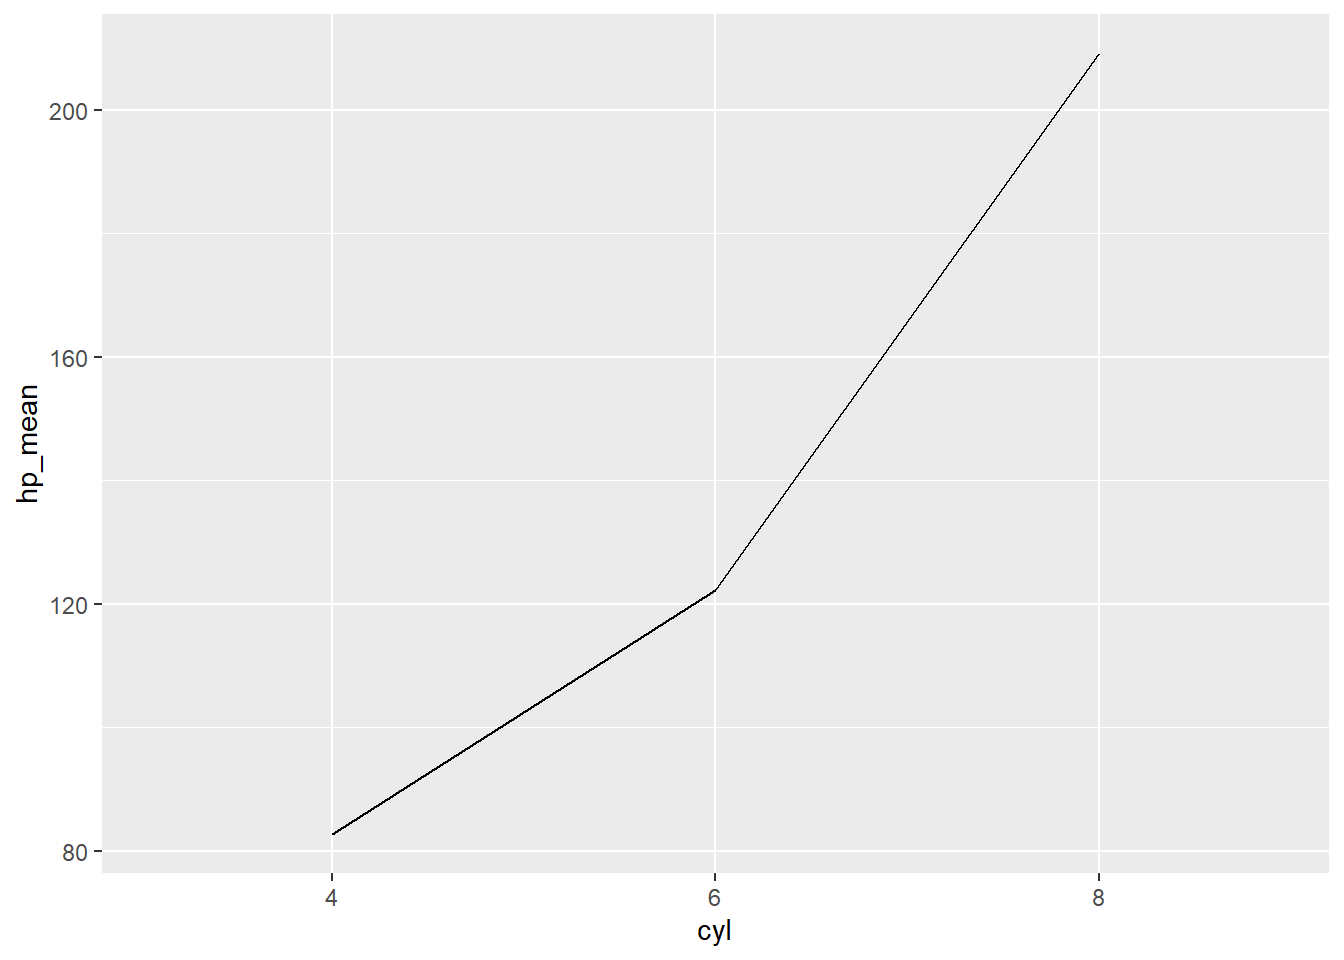
Now let’s use this new data set to graph how horsepower (hp) changes as the number of cylinders (cyl) increases:
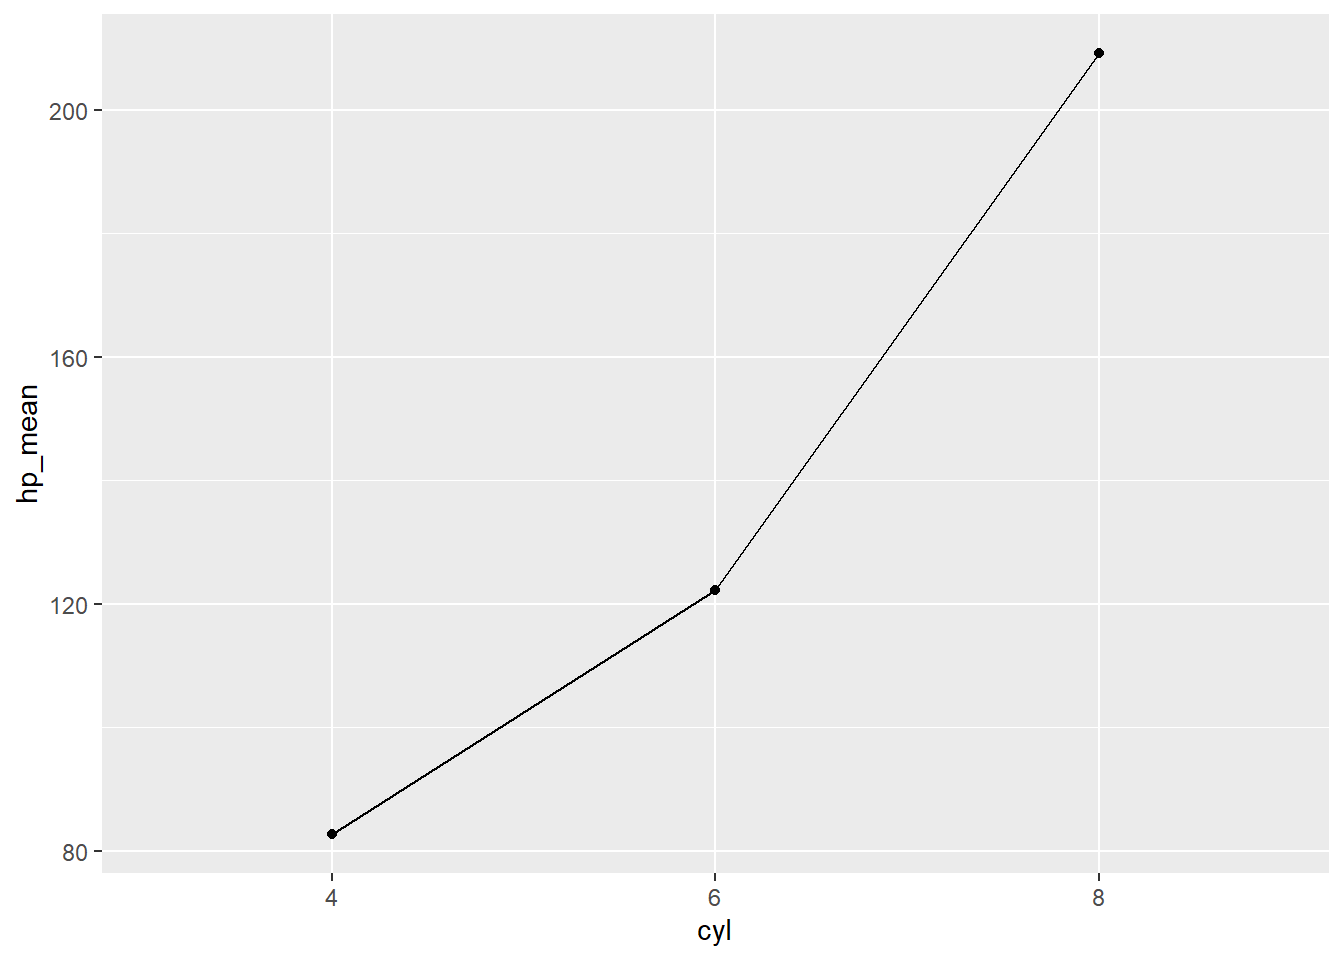
You may also want to add a geom_point() layer to emphasize the mean values for each level of cylinder:
You may have noticed we included the code “group = 1” in the aesthetic for geom_line(). Why? Let’s see what happens when we don’t do this:
## `geom_line()`: Each group consists of only one
## observation.
## ℹ Do you need to adjust the group aesthetic?
You actually get a message that says, “geom_path: Each group consists of only one observation. Do you need to adjust the group aesthetic?”
What does this mean?
The key concept is “group” in aes().
The rule is simple:
geom_line()tries to connect data points that belong to same group.- Different levels of factor variables are understood by
geom_line()as different groups.
So, by specifying “group = 1” in aes(), we tell geom_line() to treat the points as being part of the same group, and thus to connect them. Alternatively, if you do want to create separate lines for different groups, you can put the grouping variable in place of “1” (e.g. “group = gender”).
Additionally, you can add error bars to show the degree of variation surrounding each mean using a geom called geom_errorbar(). Note that geom_errorbar() needs at least two arguments: the extent to which the variation spans above (ymax) and below (ymin) the mean. Here, we are just adding one standard deviation above and below the mean. If you were using estimated means from a statistical analysis, we could show standard error bars instead of standard deviations (we’ll get to how to do that in a later workshop).
Let’s take a look at how to create error bars for +/- 1 standard deviation:
d_means %>%
ggplot(aes(x = cyl, y = hp_mean, group = 1)) +
  geom_point()+
geom_line()+
geom_errorbar(aes(ymin=hp_mean-hp_sd, ymax=hp_mean+hp_sd), width=.2)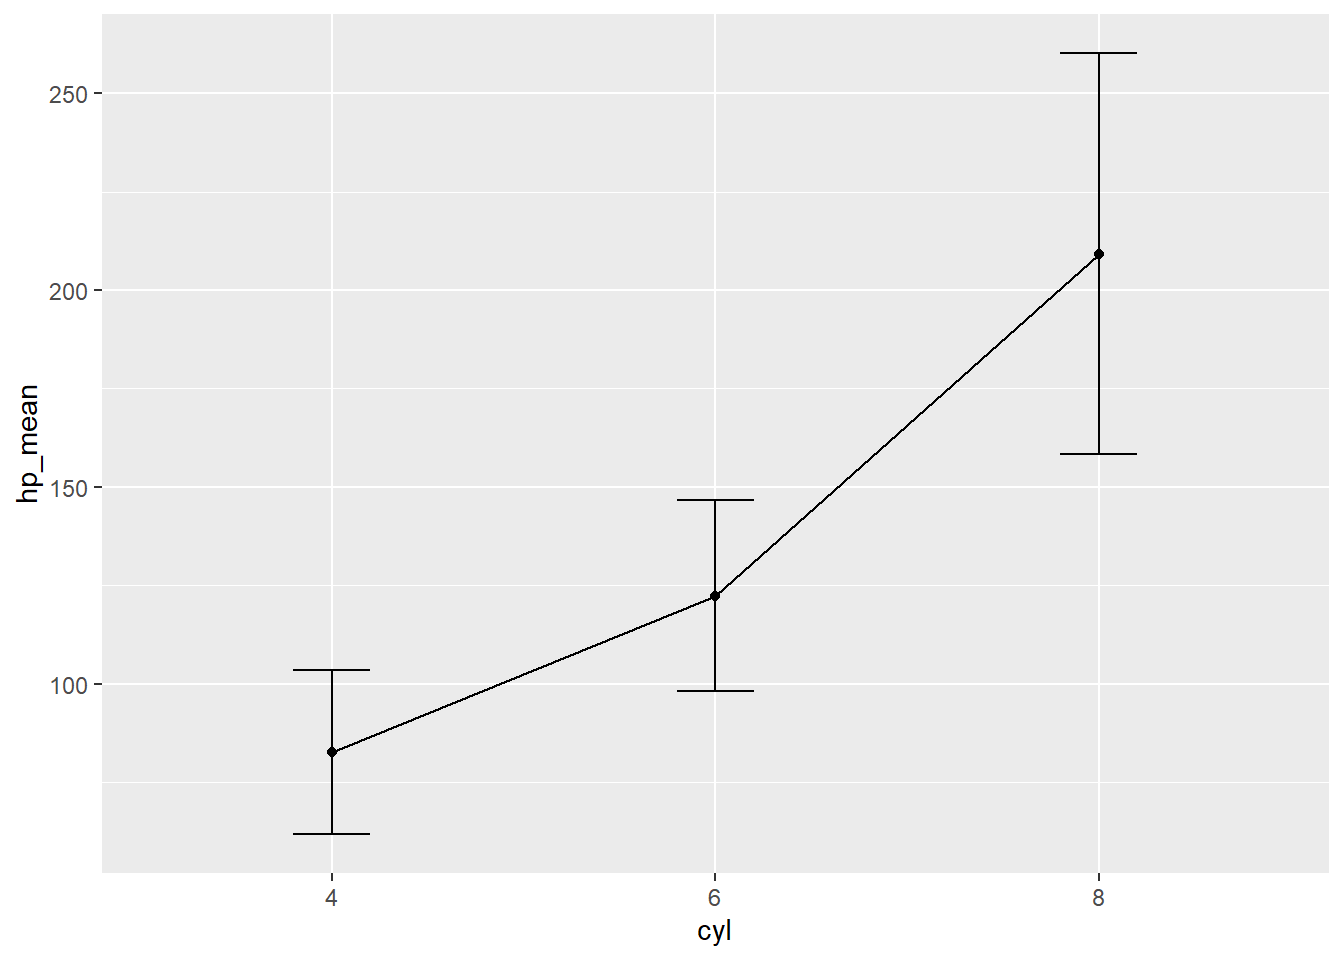
Practice
Make a line graph where you compare the median (use the median() function) level of miles per gallon depending on the numer of gears the car has. Make errorbars represent the iqr (use the IQR() function) of the data
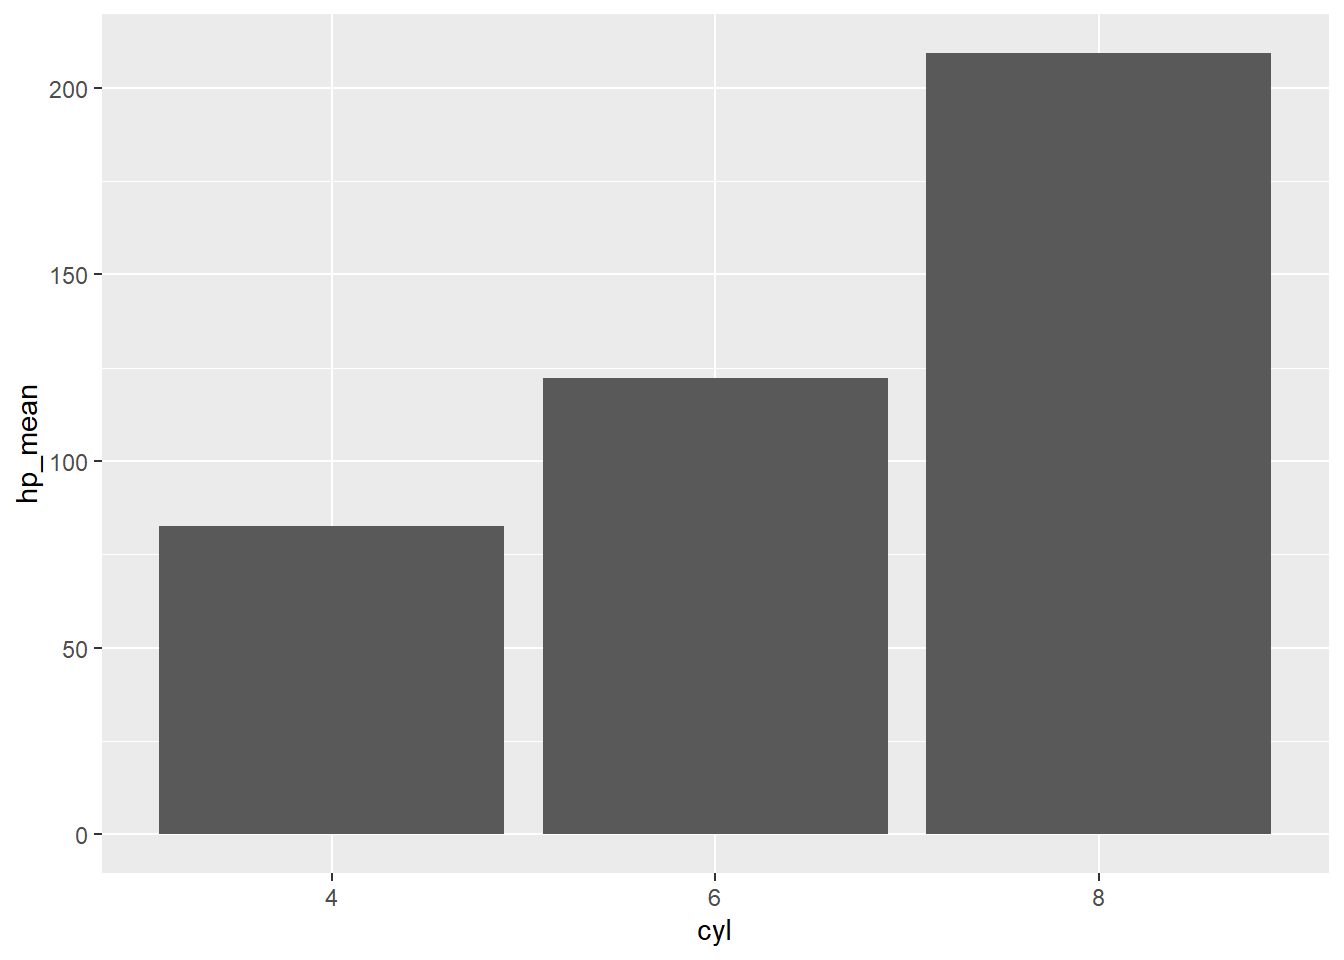
Now let’s look at a bar chart using the same variables:
And apply the same error bars:
d_means %>%
ggplot(aes(x = cyl, y = hp_mean)) +
  geom_col() +
  geom_errorbar(aes(ymin=hp_mean-hp_sd, ymax=hp_mean+hp_sd), width=.2)
Practice
Within V shaped engined cars (vs = 0; hint: use filter()), make a column chart of the mean weight of manual and automatic cars. Make the errorbars span the whole range of the distribution (they start at the weight of the lightest car and end on the weight of the heaviest). Hint: calculate these with min() and max() inside the summarize function.
We will go into more depth into visualizations and ggplot the next workshop, so hang tight!
3.3 Review: End Notes
Today, we covered:
*The basic structure of ggplots
*Common aesthetics
*Common geoms
*How to change the presentation of your ggplot
3.3.1 Feedback
As a learner, your superpower is knowing what is and isn’t working for your learning. If you have 2 minutes, we would love if you shared your superpower with us!
Scan the QR code below with your phone to provide brief feedback on this workshop:

3.3.2 What’s an R Markdown again?
This is the main kind of document that I use in RStudio, and I think its one of the primary advantage of RStudio over base R console. R Markdown allows you to create a file with a mix of R code and regular text, which is useful if you want to have explanations of your code alongside the code itself. This document, for example, is an R Markdown document. It is also useful because you can export your R Markdown file to an html page or a pdf, which comes in handy when you want to share your code or a report of your analyses to someone who doesn’t have R. If you’re interested in learning more about the functionality of R Markdown, you can visit this webpage
R Markdowns use chunks to run code. A chunk is designated by starting with {r}and ending with This is where you will write your code. A new chunk can be created by pressing COMMAND + ALT + I on Mac, or CONTROL + ALT + I on PC.
You can run lines of code by highlighting them, and pressing COMMAND + ENTER on Mac, or CONTROL + ENTER on PC. If you want to run a whole chunk of code, you can press COMMAND + ALT + C on Mac, or ALT + CONTROL + ALT + C on PC. Alternatively, you can run a chunk of code by clicking the green right-facing arrow at the top-right corner of each chunk. The downward-facing arrow directly left of the green arrow will run all code up to that point.
3.3.3 Some useful resources to continue your learning
A useful resource, in my opinion, is the stackoverflow website. Because this is a general-purpose resource for programming help, it will be useful to use the R tag ([R]) in your queries. A related resource is the statistics stackexchange, which is like Stack Overflow but focused more on the underlying statistical issues.